Plot a thing
Usage
# S3 method for class 'tree_mrf_penalty'
visualize(
  x,
  graph = TRUE,
  layout = "stress",
  circular = FALSE,
  xlab = NULL,
  ylab = NULL,
  title = NULL,
  subtitle = NULL,
  caption = NULL,
  fill_scale = NULL,
  ...
)
Arguments
- x
an object of class
"dendrogram_mrf_penalty"- graph
logical;
- layout
character;
- circular
logical;
- xlab, ylab, title, subtitle, caption
character; labels for plots. If
xlaborylabare not supplied, a suitable default is used.- fill_scale
a suitable fill scale to use if plotting the penalty matrix
- ...
arguments passed to other methods and ultimately on to
ggraph::create_layout()ifgraph = TRUE.
Examples
# example code
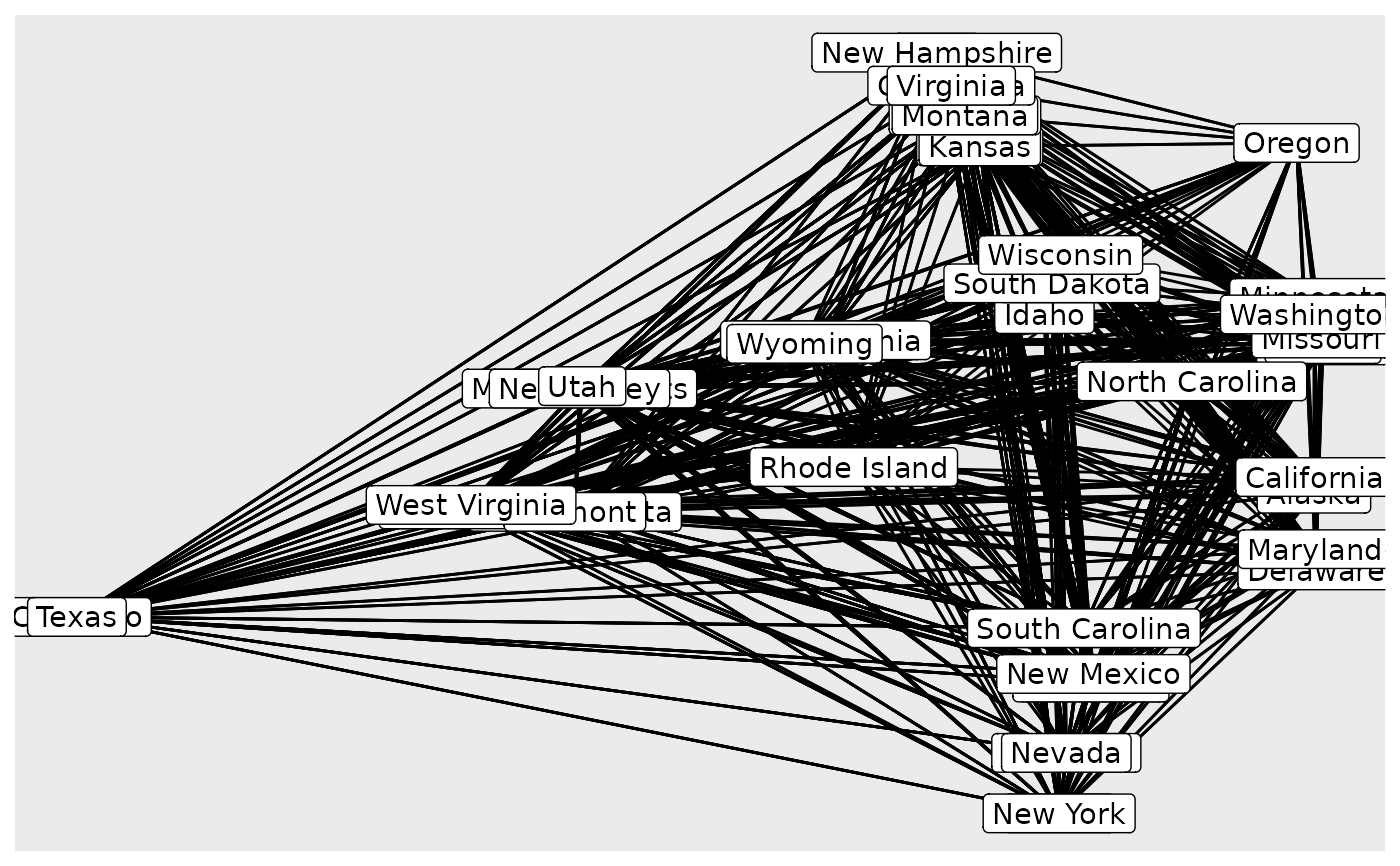
hc <- hclust(dist(USArrests), "complete")
mrf_penalty(hc, internal_nodes = FALSE) |>
visualize()